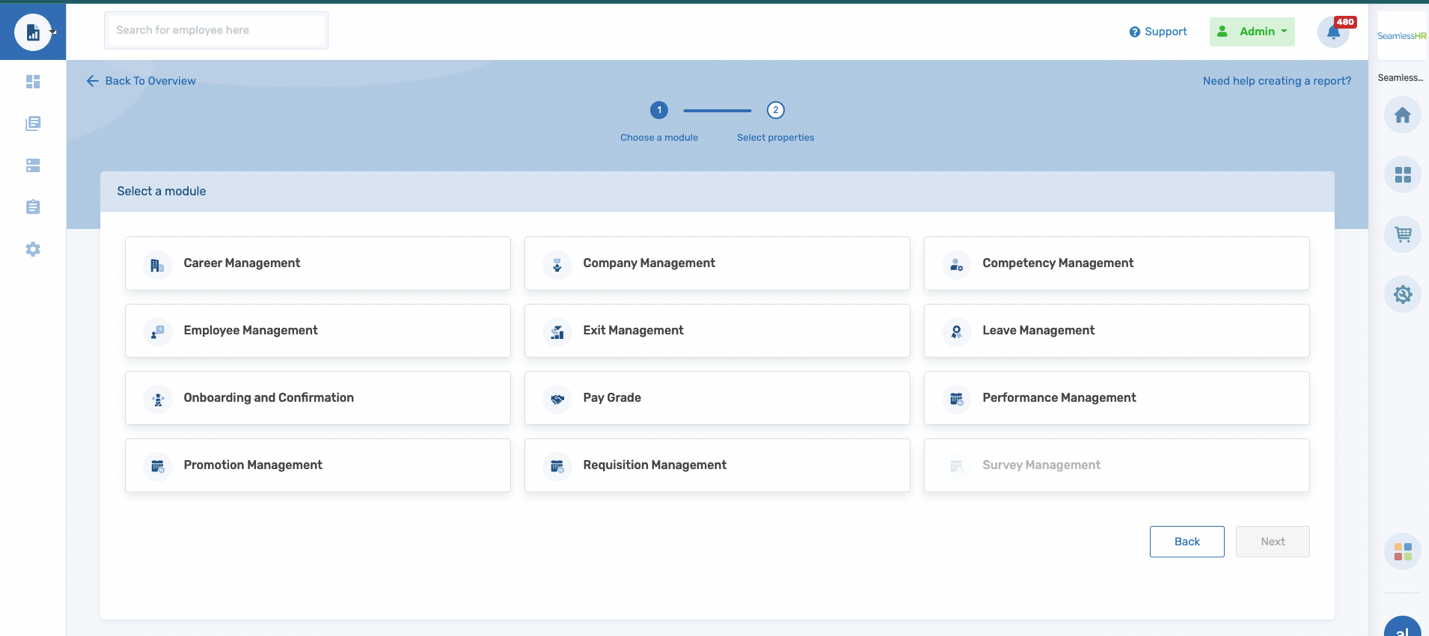
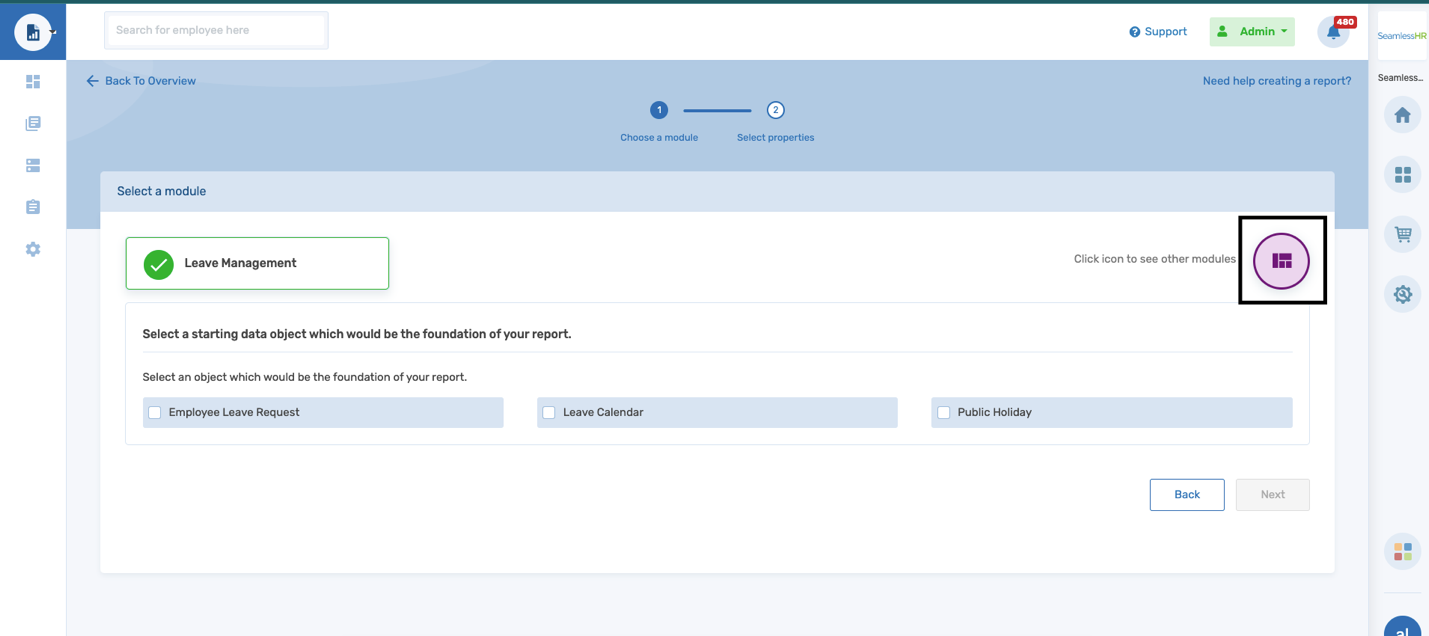
When a user selects the create report from the overview page, he/she is welcomed with a list of all the modules within the HRMS Apps.
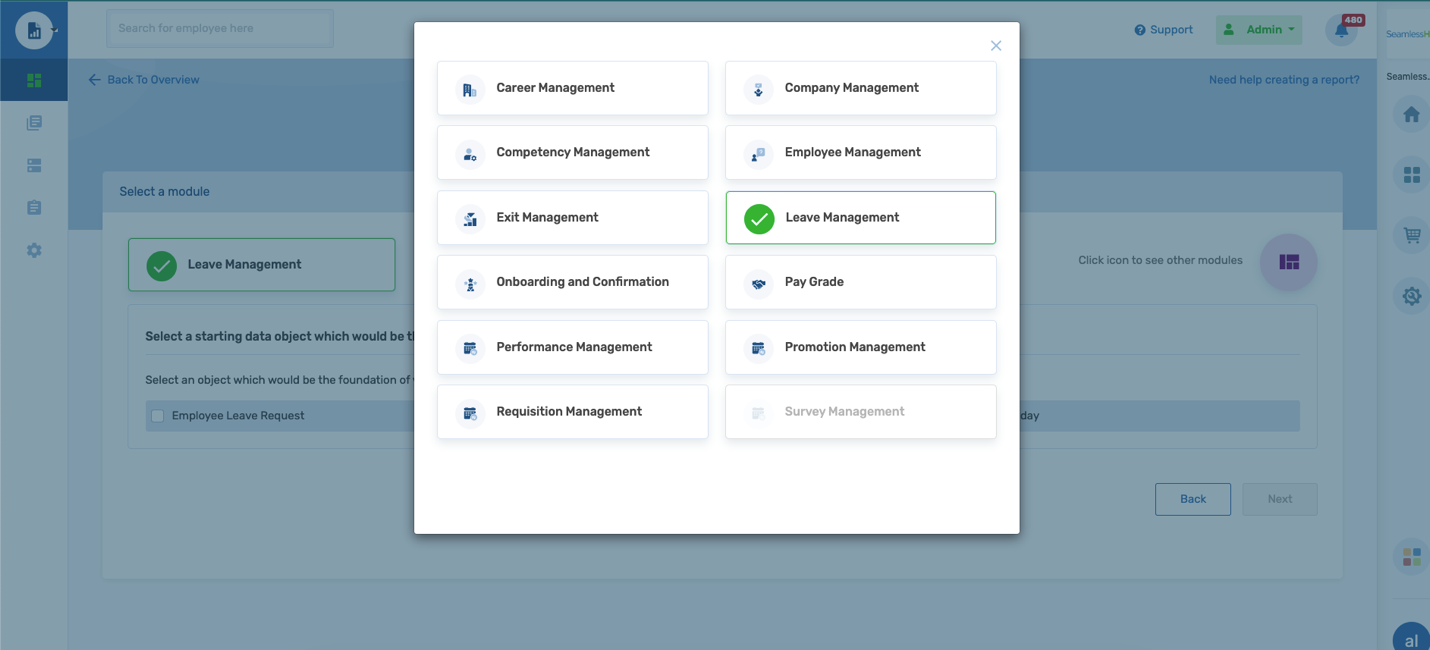
Although the modules are displayed alphabetically, only active (purchased) modules would be listed first. All inactive (unpurchased) modules would be listed below the active modules and would be disabled.
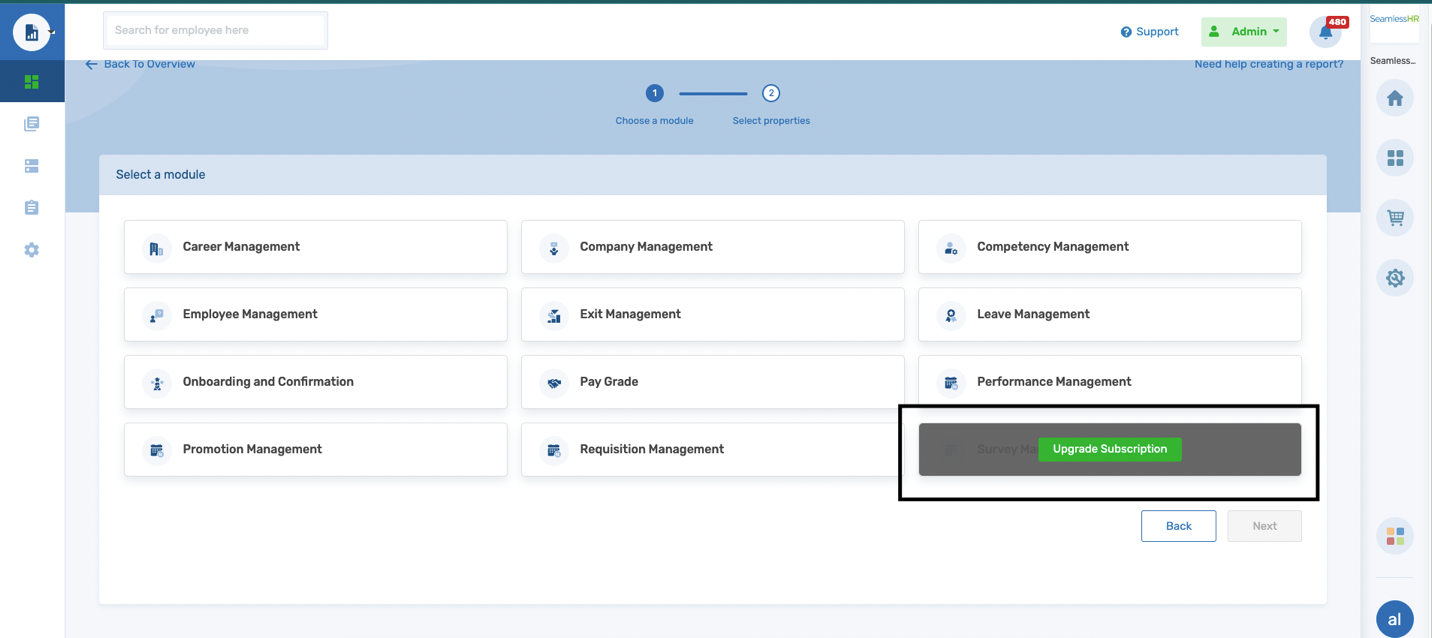
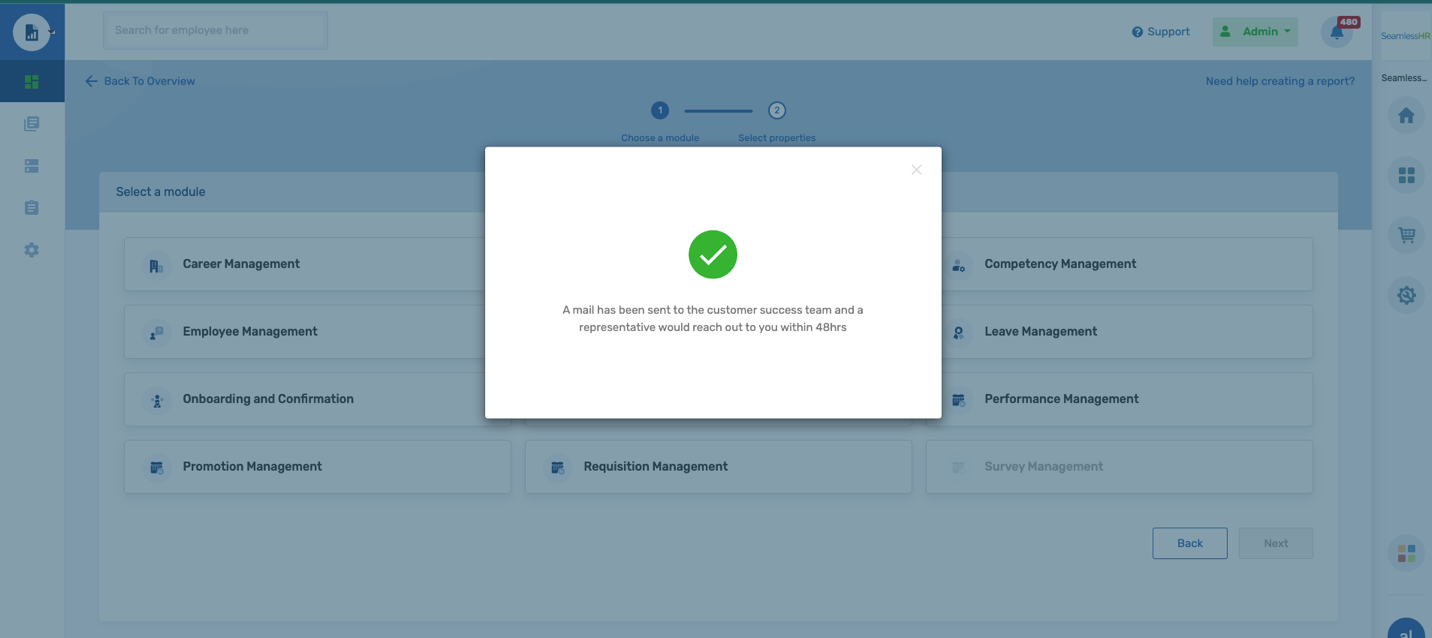
On all disabled/inactive modules when a user hovers over any module there is an upgrade option if the user would like to add/purchase the module to the list of active modules within the organization and across subsidiaries.
When the user selects the module “Leave Management” they see the suggestive starting data objects. The user is required to select a starting data object as the foundation of the report. Only one starting data object can be selected.
A data object: A data object is a group of objects that represents a model that is associated with a database table which has properties and may have relationships to other objects
If a user requires to change the module selected. The user can select the other module icon and a list of all the subscribed modules would be displayed. The current module selected is highlighted in a green tick. Once the user selects a different module that automatically becomes the module selection.
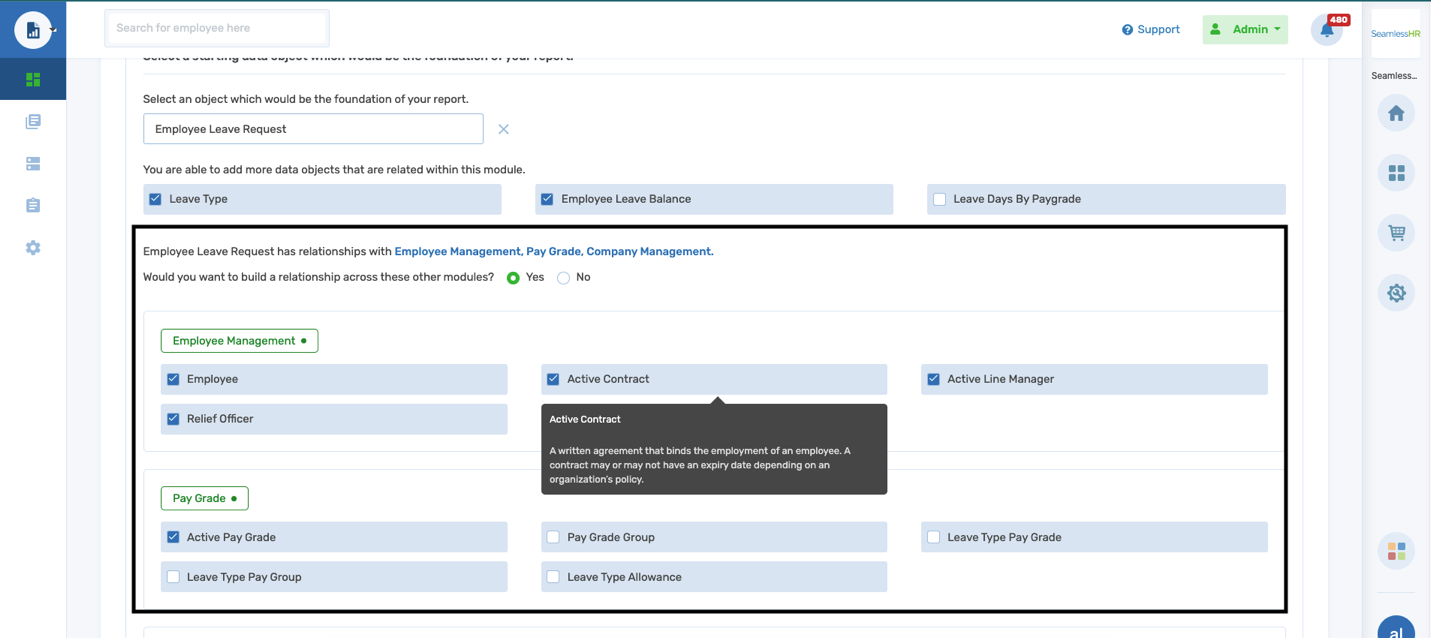
After the user has selected the starting data object, the user can still add other data objects. These additional data objects are related to the starting data object.
In this case, the module selected was the “Leave Management” module, and the starting data object is “Employee leave request”. However, “Employee leave request” has relationships with Leave type, employee leaves balance and leaves days by paygrade. The user can select any of these related data objects to expand the scope of the report to be generated.
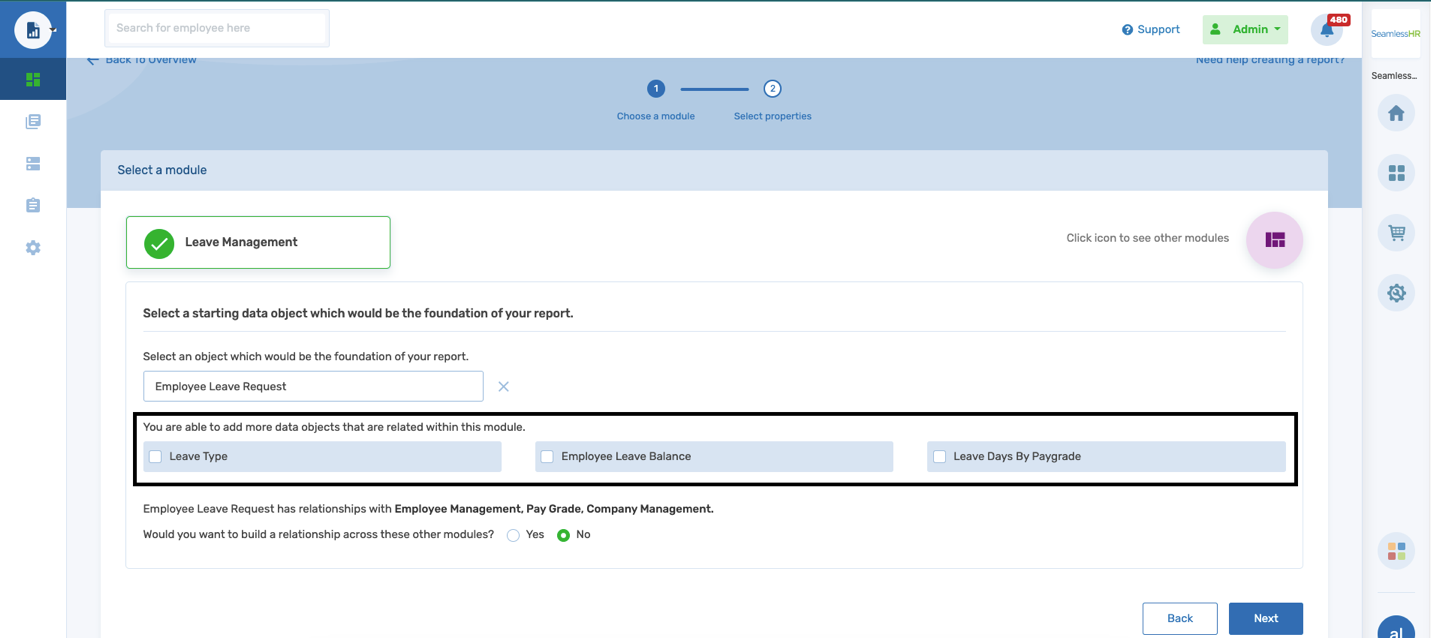
A report can be generated within a single module in the case above “Leave management”. If the user chooses to build the report within a single module, then he/she leaves the default relationship with another module toggle set to “No”.
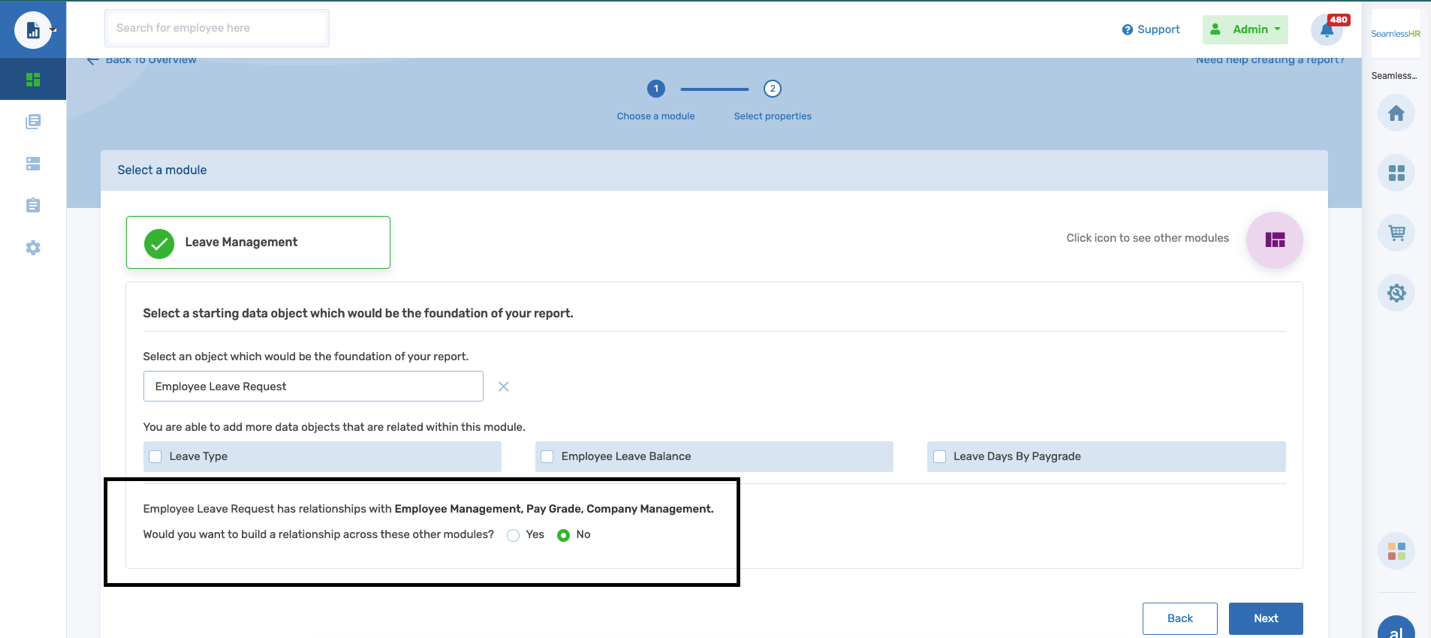
In addition, the user can also choose to build the report across other modules and would not be required to leave the already selected module “Leave management”. To create a report with a relationship to other modules the user needs to switch the toggle to “yes”.
A dropdown of other defined modules that have a relationship with the earlier selected starting data point “Employee Leave Request” has a relationship with Employee management, Pay grade, and company management.
The user can then select the data objects required to build the report within the selected modules.
Associated properties: This is a list of properties from the selected data objects used to build the report. The properties are form fields from which data is fielded from all aspects of applications within the HRMS modules and Apps.
The starting data object is always at the top of the list with its properties listed. A few of the properties are preselected and can also be deselected depending on the user's preferences.
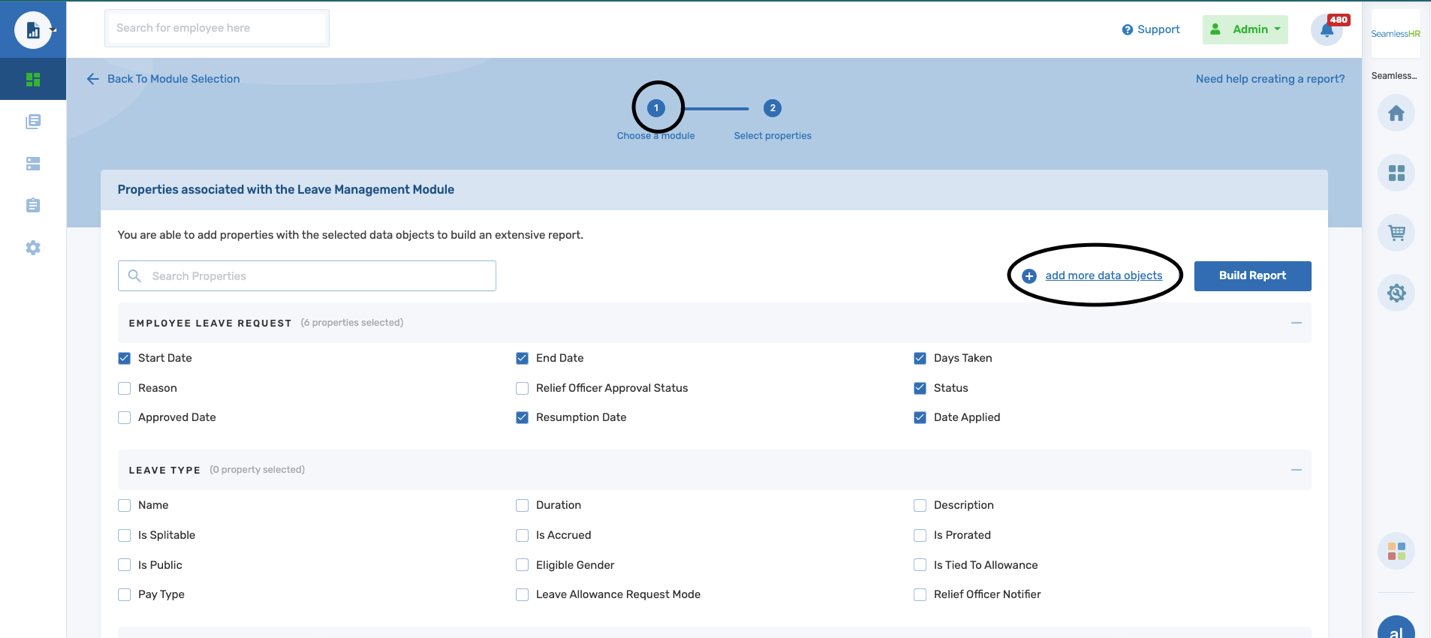
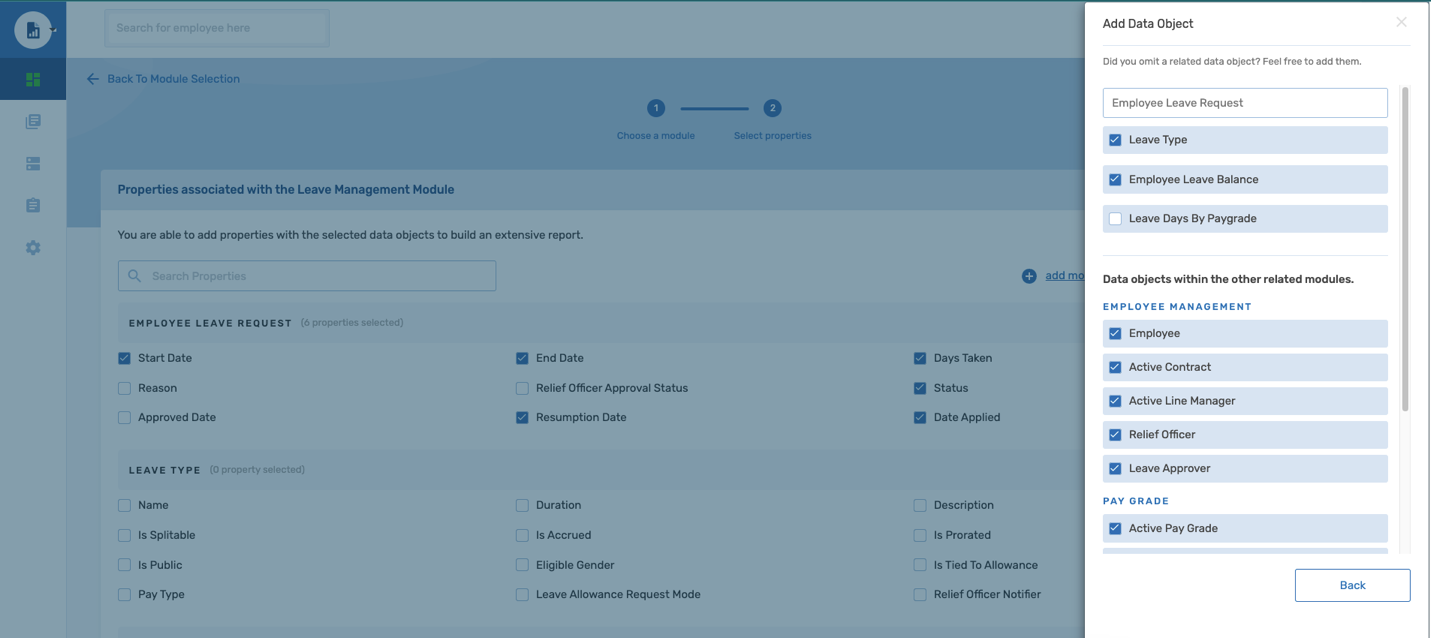
Adding Data Objects: While selecting associated properties from the already selected data objects and the user requires more data objects the user can select the “add more data object(s)” to add/remove data objects from the selection.
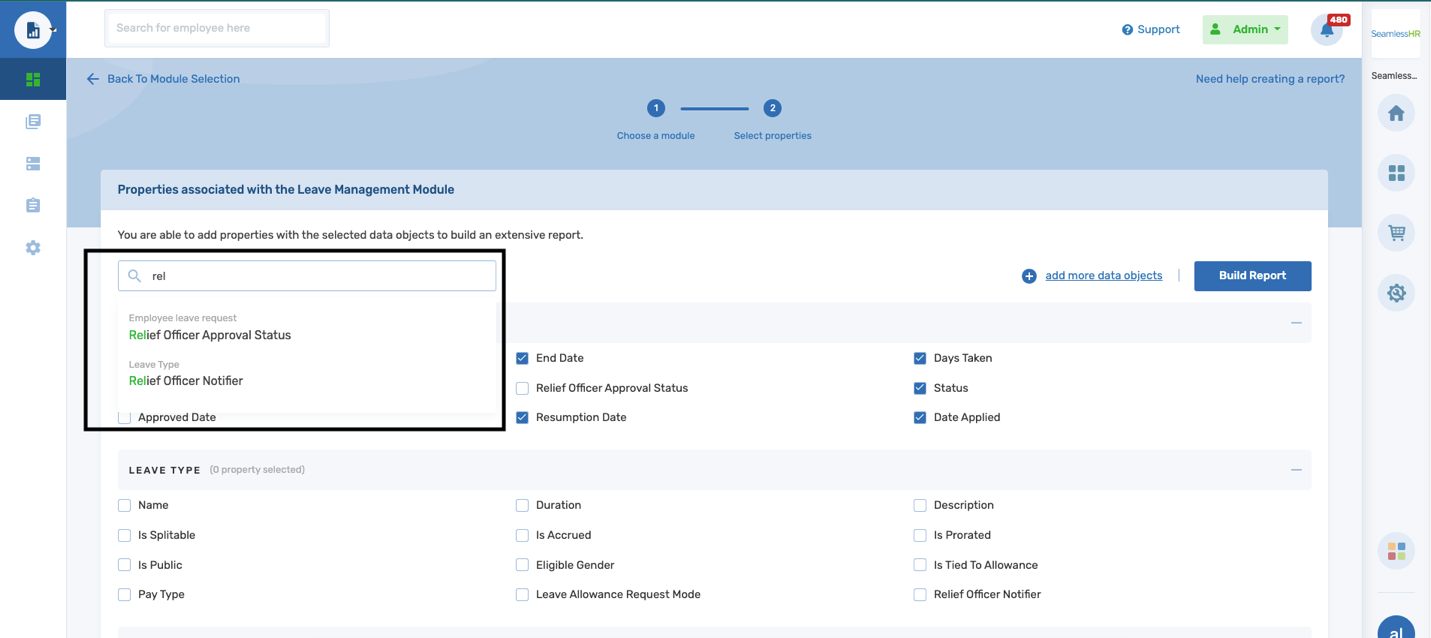
Search associated properties: There could be tons of properties listed from data objects selected and this could be overwhelming. The user can search for properties and suggestions for the properties listed. The properties name turns green and the data object that holds the property is displayed above in grey fonts. Once the user finds the property of choice and selects the property the user is taken directly to the data object with the named property.
Build report: Once all the necessary data objects and properties have been configured, the user then selects “Build Report” to generate the raw data spooled across the modules and systems database.
On the report tab, the list of selected properties can be seen on the highlighted left pane. This list can be shuffled to reorganize the data table. Moving property tiles above or below as the user sees fit.
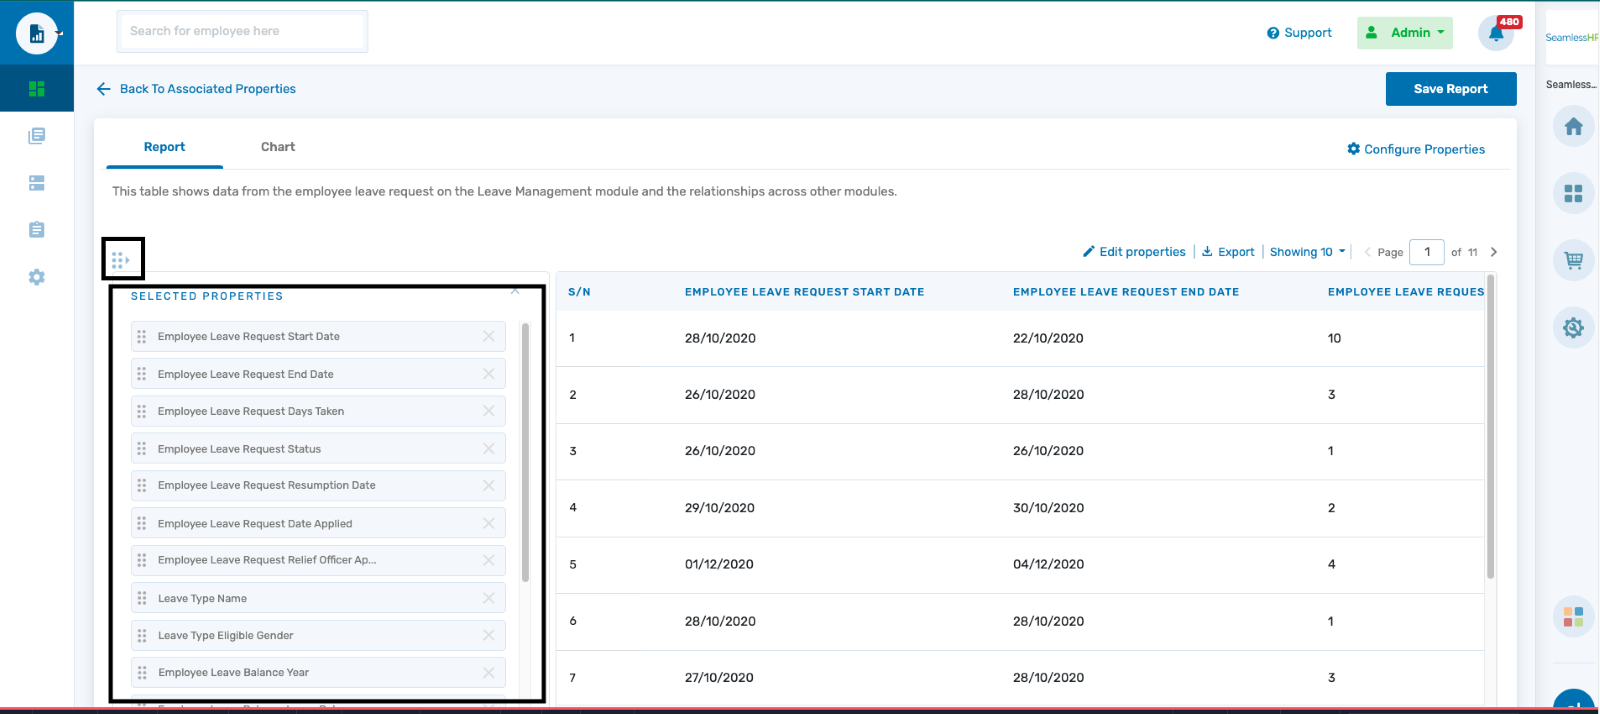
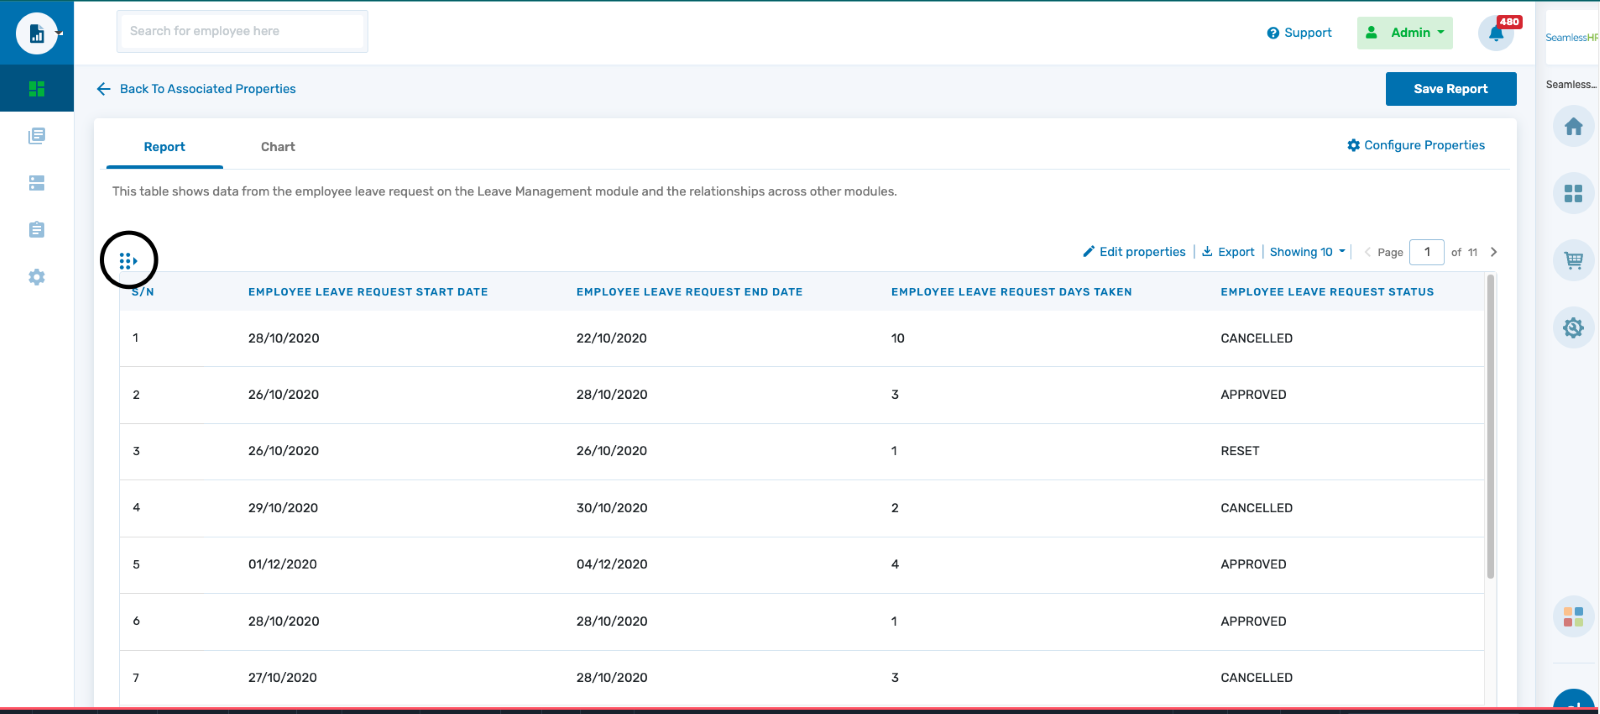
To give a full view of the report data table, the user can use the selected properties toggle to show/hide the list of selected properties.
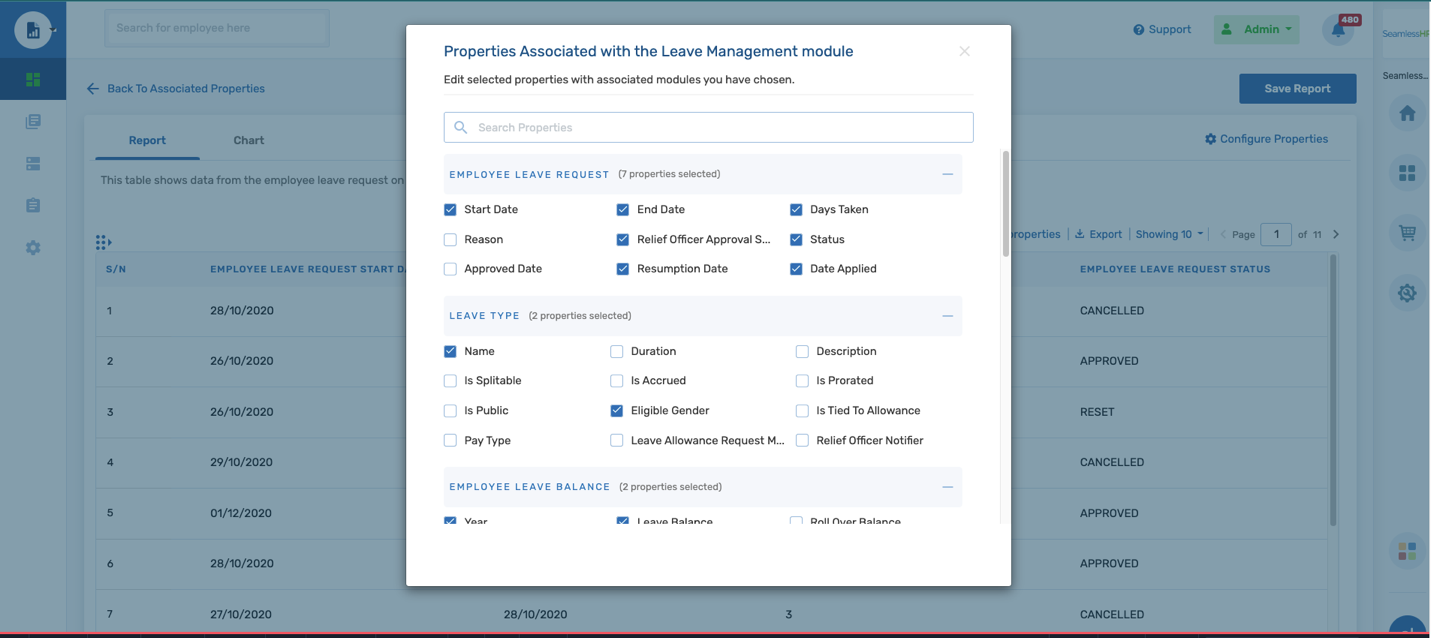
Edit properties: In the case where a property was not added to the report build the user can still add/remove more properties to the data table.
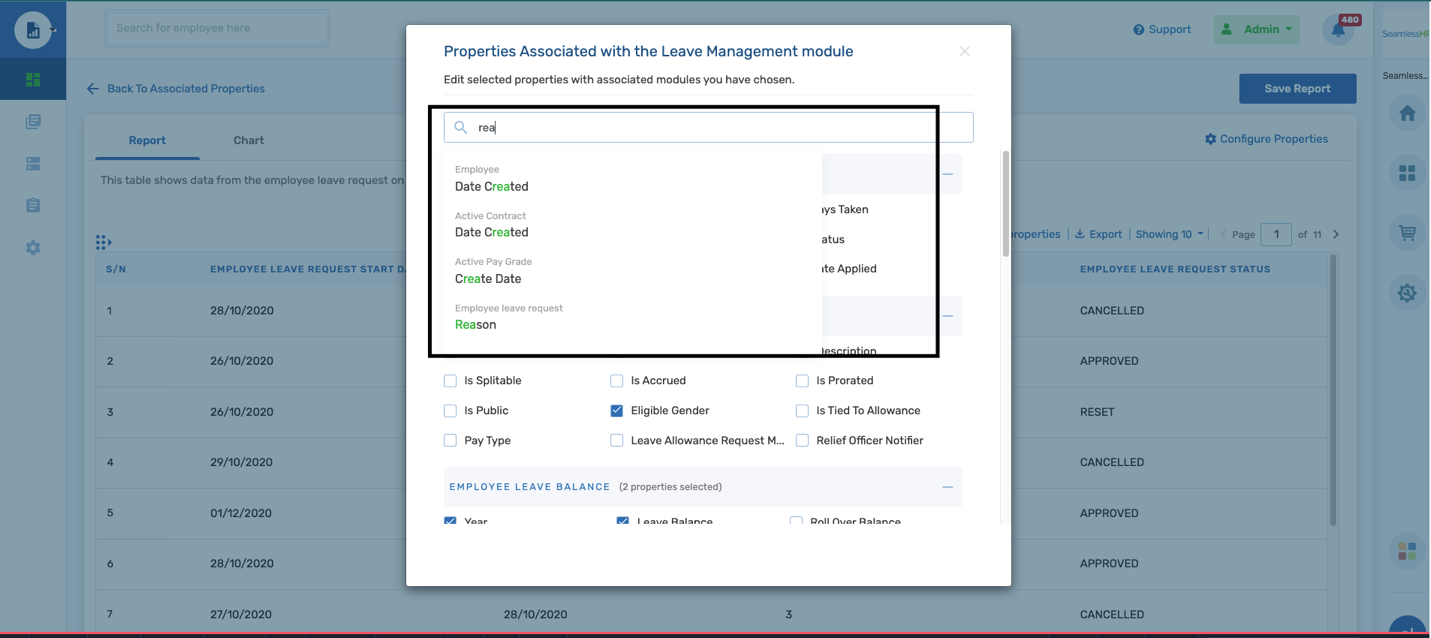
Edit properties - Search properties: The user can search for properties and suggestions for the properties listed. The properties name turns green and the data object that holds the property is displayed above in grey fonts. Once the user finds the property of choice and selects the property the user is taken directly to the data object with the named property.
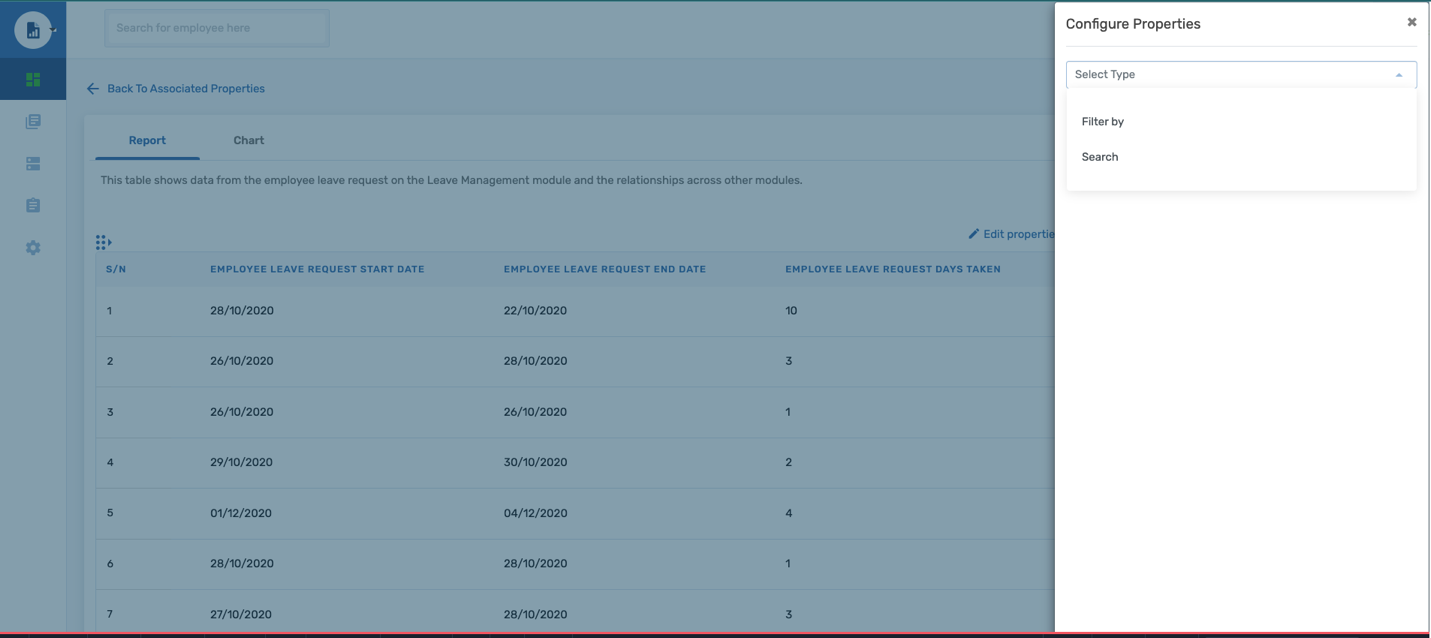
Configure properties: From the list of properties selected. The user can choose a few ways to manipulate the data generated. The configure property allows to user to manage a few data representations.
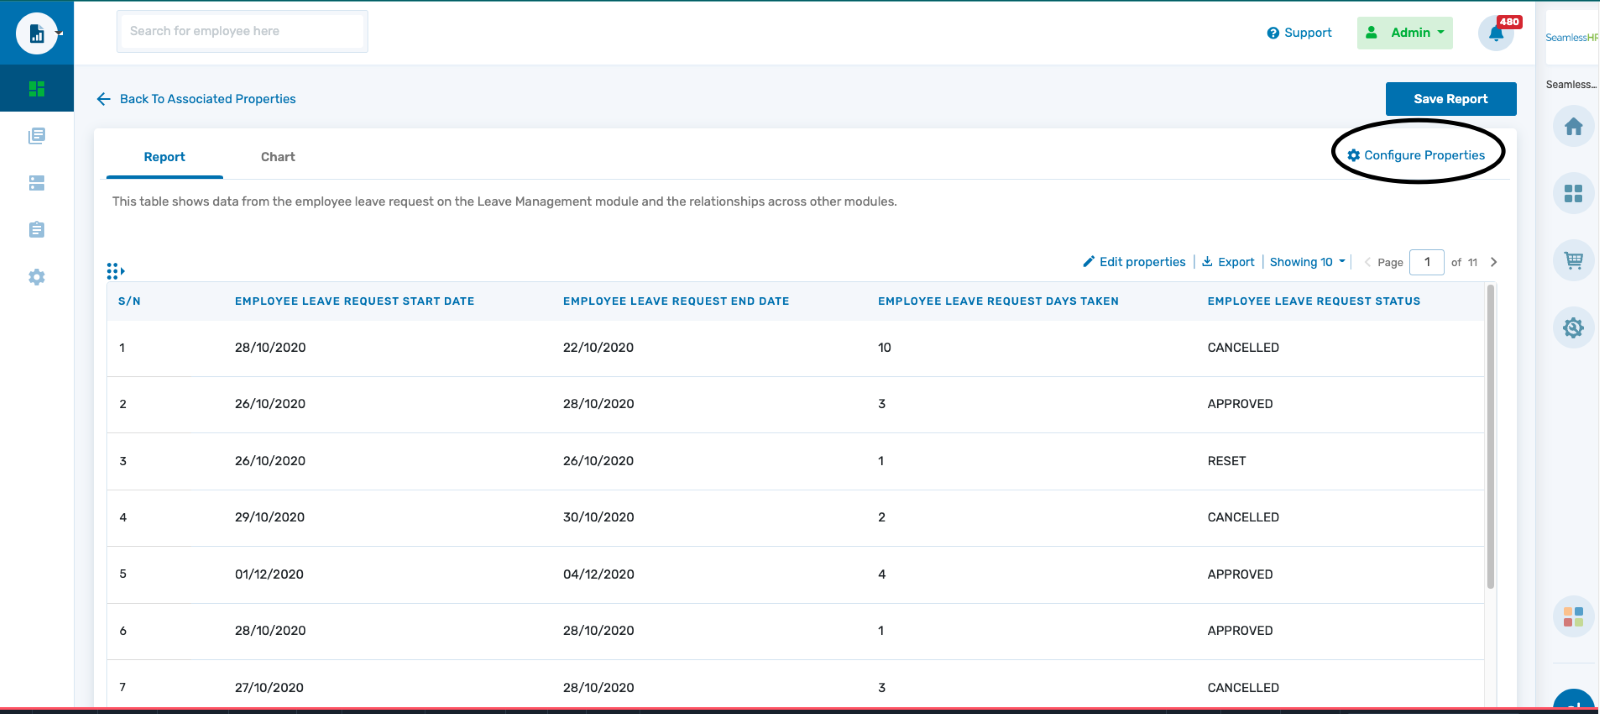
Properties can be configured in two major ways.
- Filters
- Search
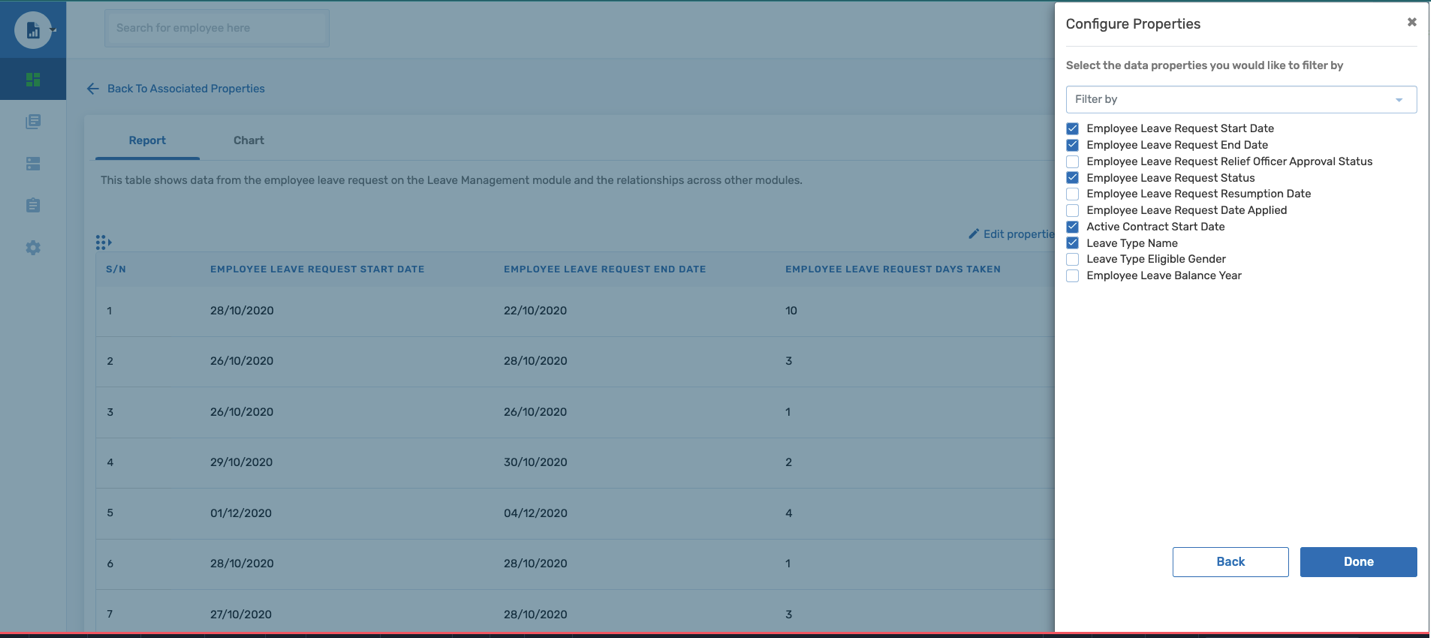
Configuring filters: Filterable properties would be generated for the user and the user can choose from the list of filterable properties.
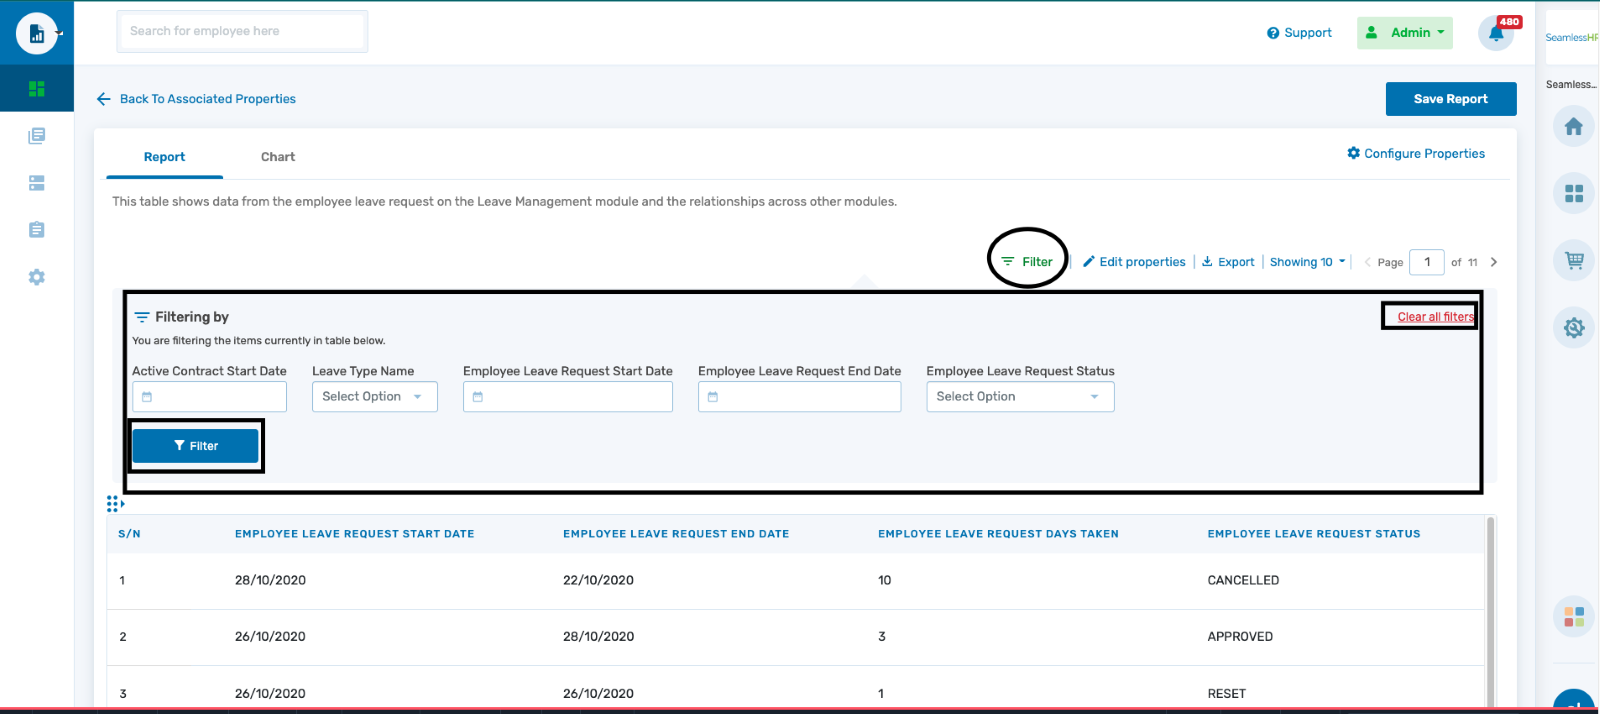
Applying filters: When a filter is configured a green filter icon is displayed. The user selects the filter icon, and a dropdown is displayed with the items selected when filters were configured. After filters have been selected the “blue filter” is used to apply the filters.
The user is also able to clear the filters selected and the user is required to select the “blue filter” used to apply the action.
Data Aggregation: Data aggregation is a data computation with multiple details and variations. Data can be aggregated into a few options
- Sum
- Count
- Min & Max
- Average
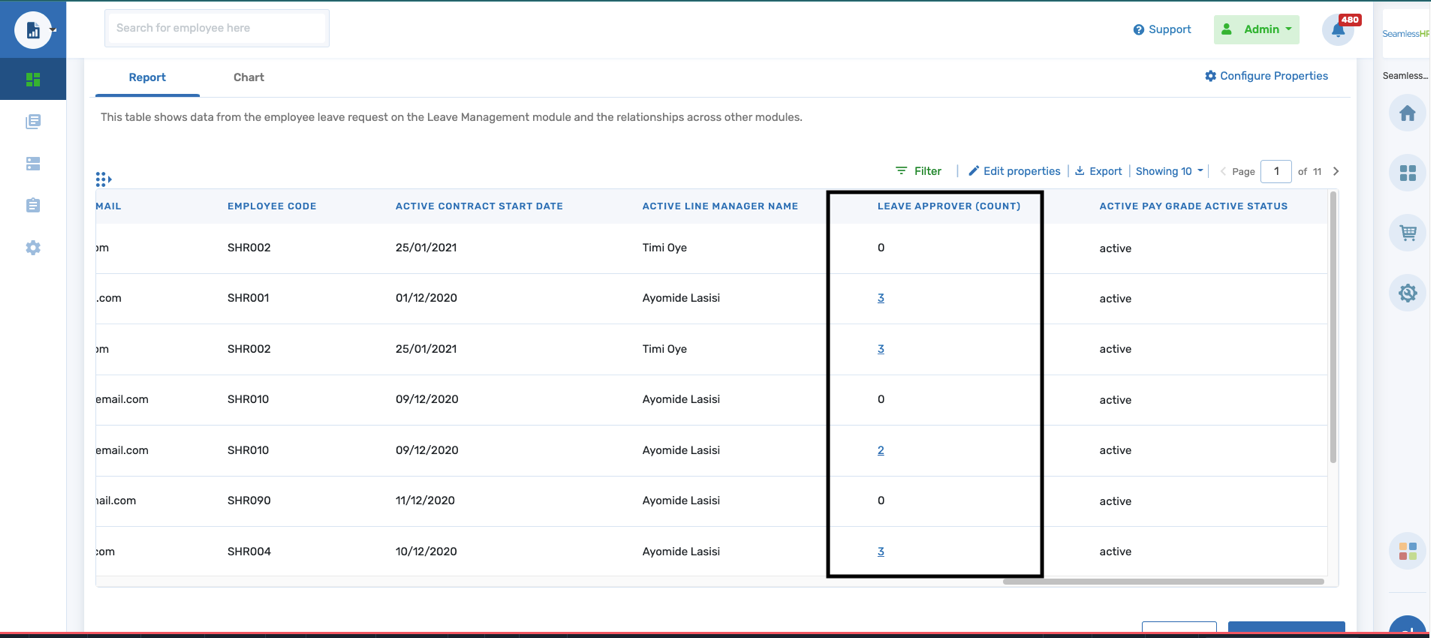
To identify aggregated data with the report table the data is highlighted and underlined in blue fonts and are often numbers
The selected aggregation is “leave approval count”. This means the total number of leave requests an employee has made over a period.
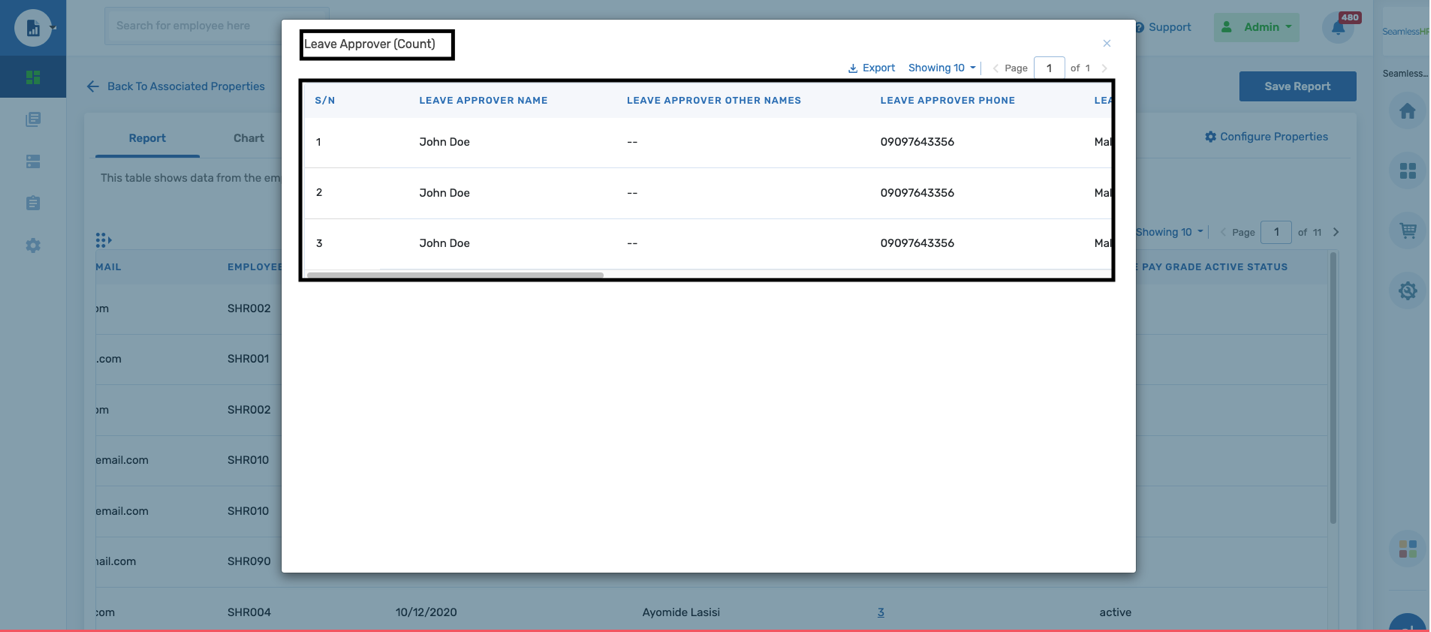
If the user requires to see the details of aggregated data, the user selects the colored integer (Number), and a drill-down process is initiated to show the details of the specific employees' leave approvals.
This result can be exported separately as a report on its own.
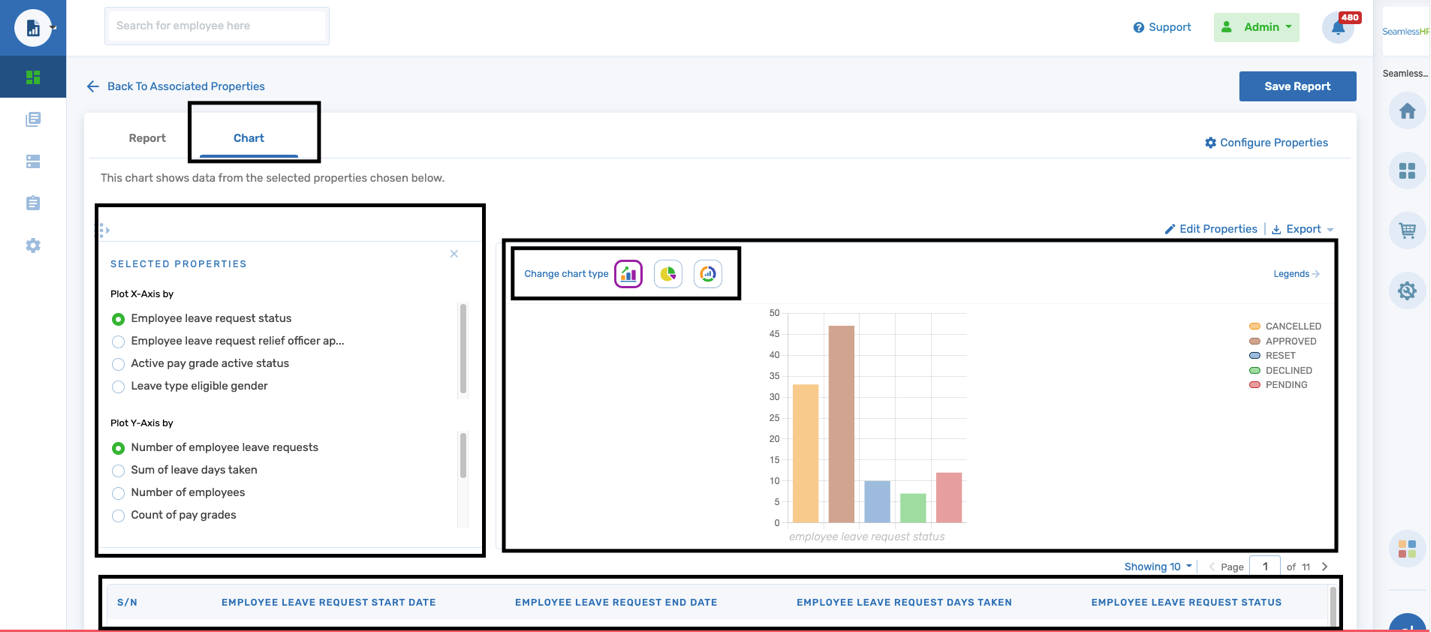
When a user toggles to the chart tab, this section configures charts using the data generated within the report table.
On the left pane, we have the selected properties a user can plot a chart. On the right pane is the chart infographics displayed as properties are selected.
There are 3 chart types available for the user to plot a chart with namely.
- Bar chart
- Pie chart
- Doughnut chart
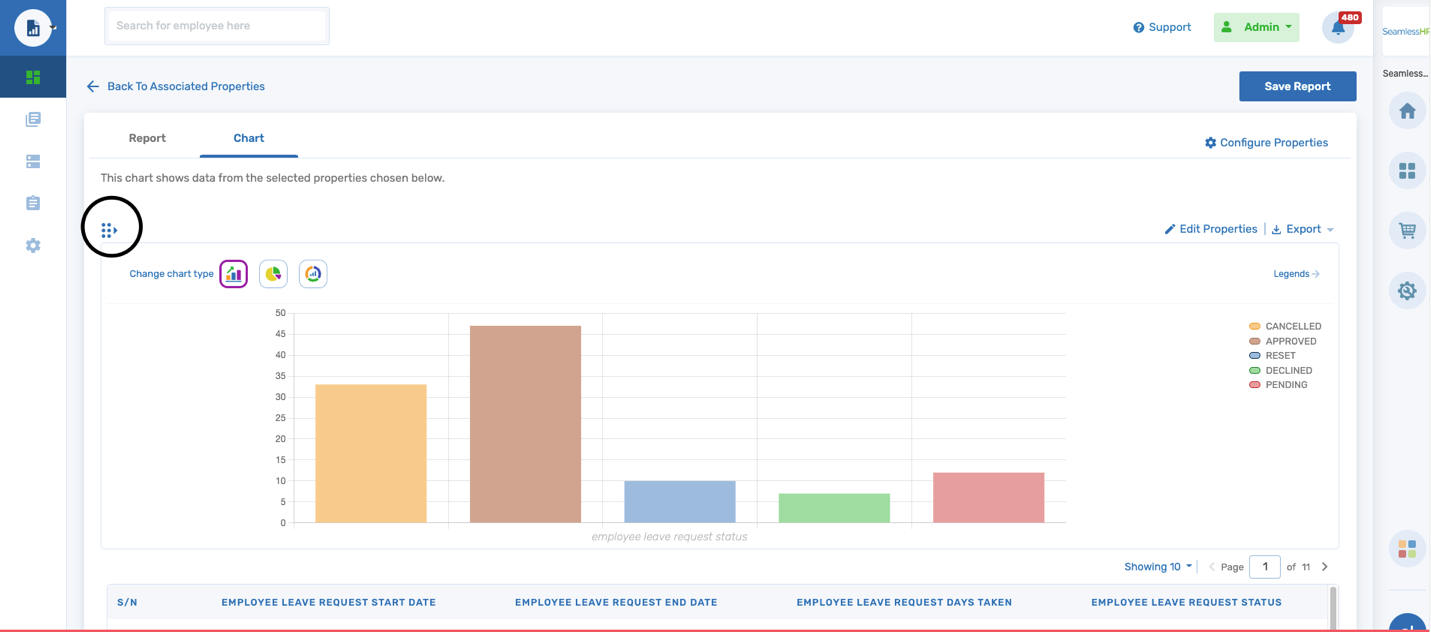
On the bottom pane of the chart is the report table for the user's ease of validation and confirmation of the data plotted on the chart.
To give a full view of the plotted chart, the user can use the selected properties toggle to show/hide the list of selected properties.
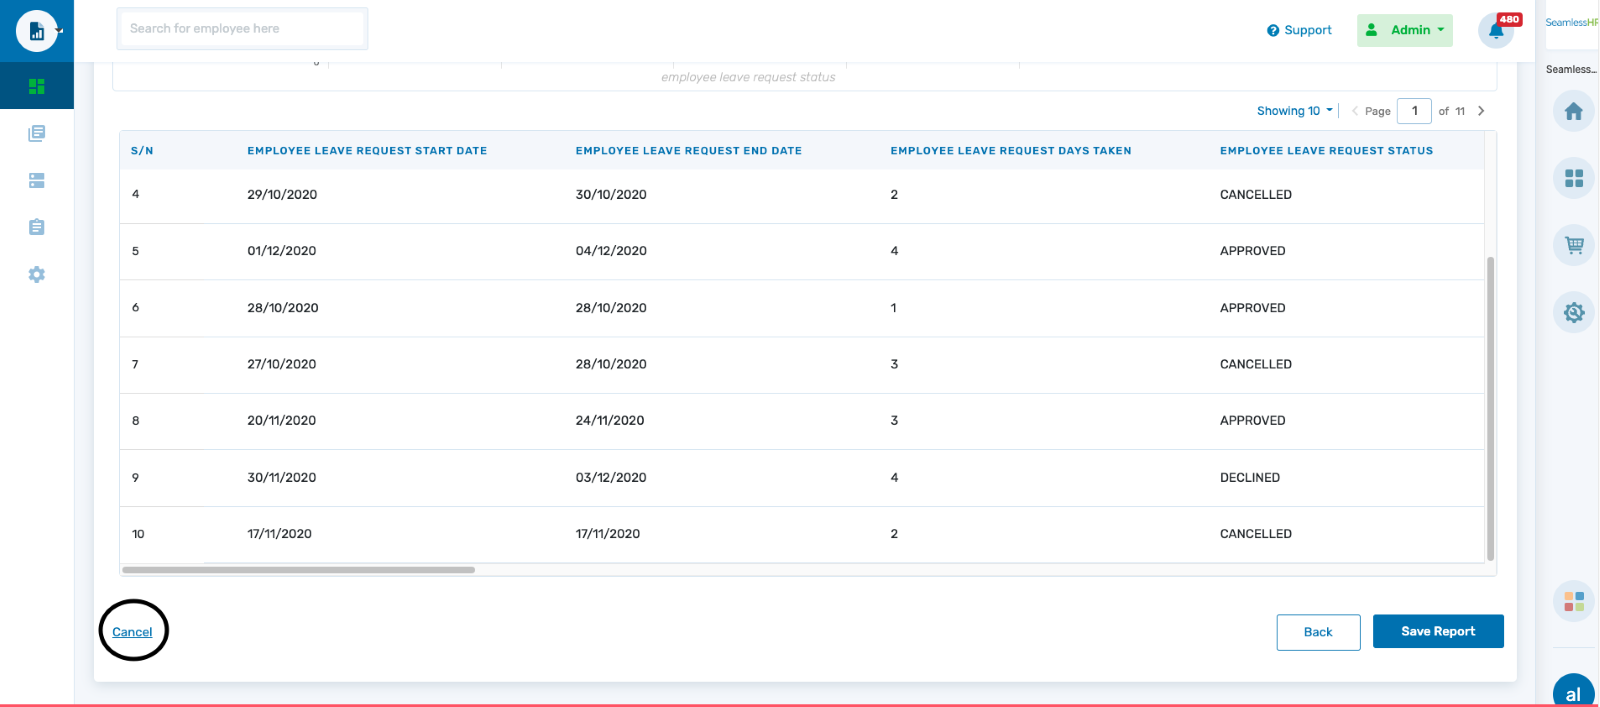
Cancel a report: When a user needs to discard a generated report, he/she can select the cancel button at the bottom of the report table. A confirmation is required to validate the users’ actions and if the user would like to lose the report configured/built.